Arctic ice melt season stopped lengthening, but the baseline is 40 days longer
A NASA-led study finds the melt season’s rise paused around 2010, even as thin sea ice and rapid Arctic warming remain.
OddBrief EditorialAI-assisted, human-reviewed
 Science
Key facts
- Record
- Satellite observations from 1979 to 2023
- Change
- Melt season is about 40 days longer than in 1979
- Trend
- Lengthening largely leveled off around 2010
- Caveat
- Thin ice and rapid warming remain
A NASA-led analysis has found that the Arctic sea ice melt season stopped getting longer at the pace seen earlier in the satellite record around 2010. The result is easy to misread. The season remains about 40 days longer than in 1979, the ice is much thinner, and the region continues to warm rapidly. What appears to have changed is the recent trend in the number of days between spring melt and autumn freeze-up.
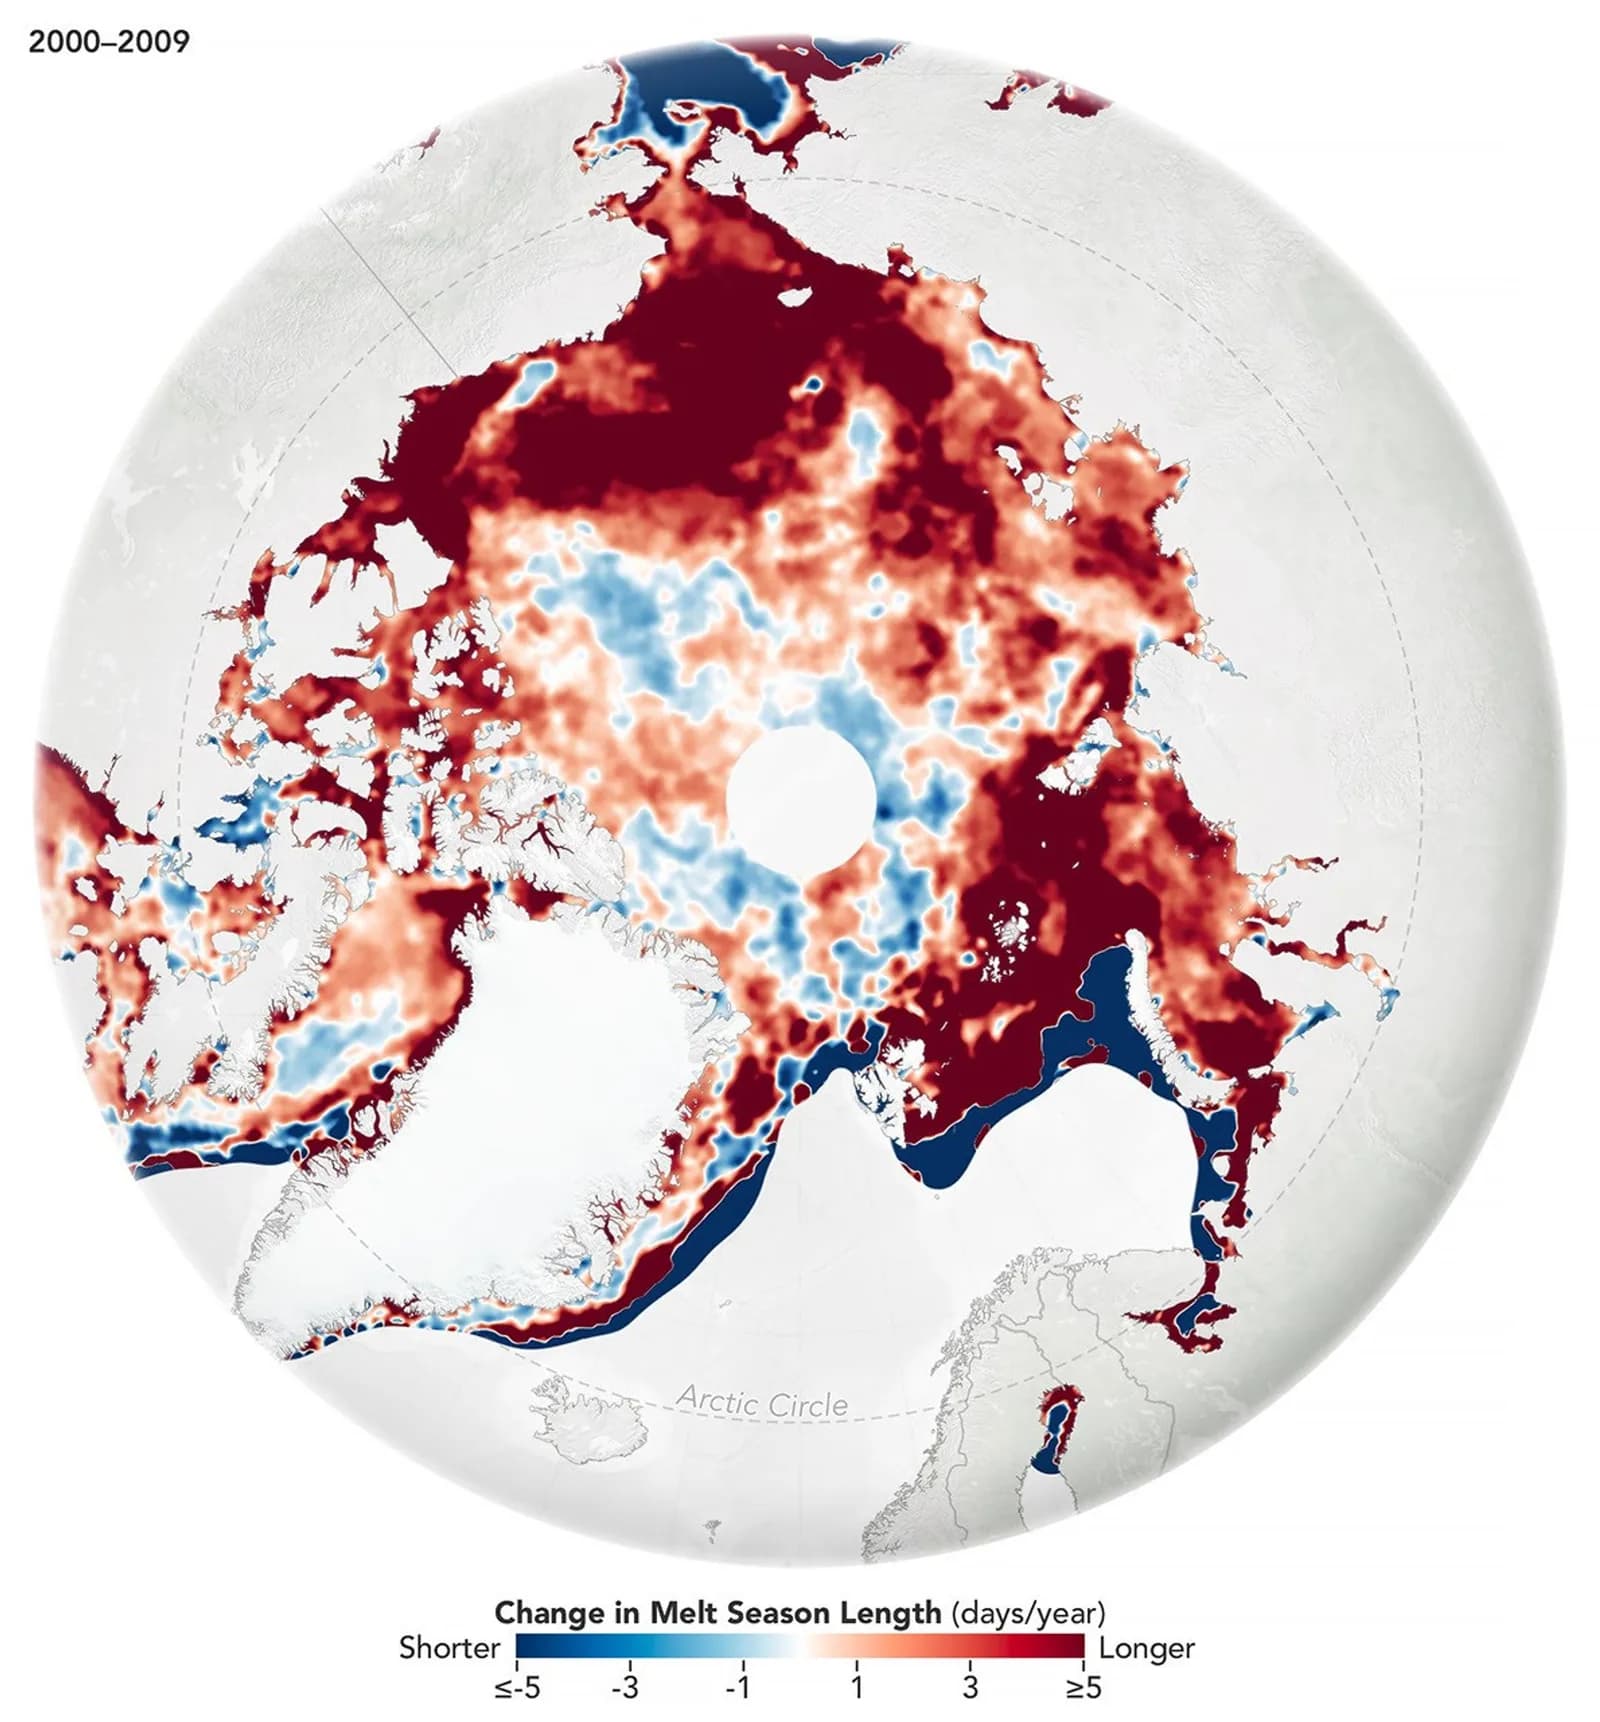
NASA Earth Observatory published the finding on September 21, alongside maps comparing the 2000s with 2010 to 2023. The researchers examined satellite observations from 1979 through 2023. They describe a shift from a strong lengthening trend to a highly variable period whose long-term average is comparatively flat.
The freeze-up mattered most
The study tracked when sea ice began melting each spring and when it froze again in autumn. Much of the earlier increase in season length came from later freeze-up, rather than an equally large shift toward earlier spring melting.
During the 2000s, shrinking ice cover exposed dark ocean water to sunlight. The water absorbed more energy, which delayed the return of ice and extended the melt season. NASA's map shows parts of the Arctic where the season lengthened by as much as five days per year in that decade. That figure describes a regional trend on the map, not the entire Arctic basin.
The newly published maps also make the contrast visible. Deep reds dominate much of the earlier period, while the later map mixes weaker increases and decreases. Those colors show rates of change over the two periods. They do not mean that the ice recovered to its former thickness or that Arctic temperatures stopped rising.
Why a pause is not a recovery
NASA says changes in cloud patterns since 2010 reduced sunlight reaching parts of the Arctic Ocean. Year-to-year variations in clouds, storms and wind now have more influence on the length of the melt season because a greater share of the remaining ice is young and thin.
Linette Boisvert, a NASA Goddard ice scientist and study co-author, points to the loss of older multiyear ice as one reason the system is more variable. The agency says the Arctic continues to warm nearly four times faster than the global average. A stable average for this one measure therefore cannot be used as evidence that the broader climate problem has stabilized.
There is also a limit to the apparent pause. Thick ice persists north of Greenland and the Canadian Arctic Archipelago. The researchers caution that further thinning there could trigger another period of rapid loss and extend the melt season again. The data through 2023 cannot settle whether the present pattern is a lasting new regime or a temporary interval.
A measurement worth watching
Melt-season length is one way to describe a changing Arctic, alongside ice area, thickness, age and the energy entering and leaving the region. Looking at only one measure would flatten a complicated picture. The value of the new study is its narrower finding: the historical lengthening was substantial, but its trajectory changed in the last part of the record.
Future satellite observations will test whether atmospheric variability continues to dominate this measure and whether the late-freeze pattern resumes. For now, the maps offer a striking reminder that a plateau in a trend can coexist with a much warmer, more fragile baseline.
Sources
- Arctic Melt Season Length Levels OffNASA Earth Observatoryprimary source