A map finds nearly 2,000 valleys beneath Greenland's ice
NASA-led researchers traced buried valleys from subtle patterns on the ice surface. About a third were newly identified, and the map may help refine ice-flow models.
OddBrief EditorialAI-assisted, human-reviewed
 Science
Key facts
- Mapped
- 1,943 subglacial valleys
- Newly identified
- about one-third
- Technique
- Ice Flow Perturbation Analysis
- Source
- NASA Earth Observatory, September 28, 2026
- Limit
- buried terrain inferred from surface signals
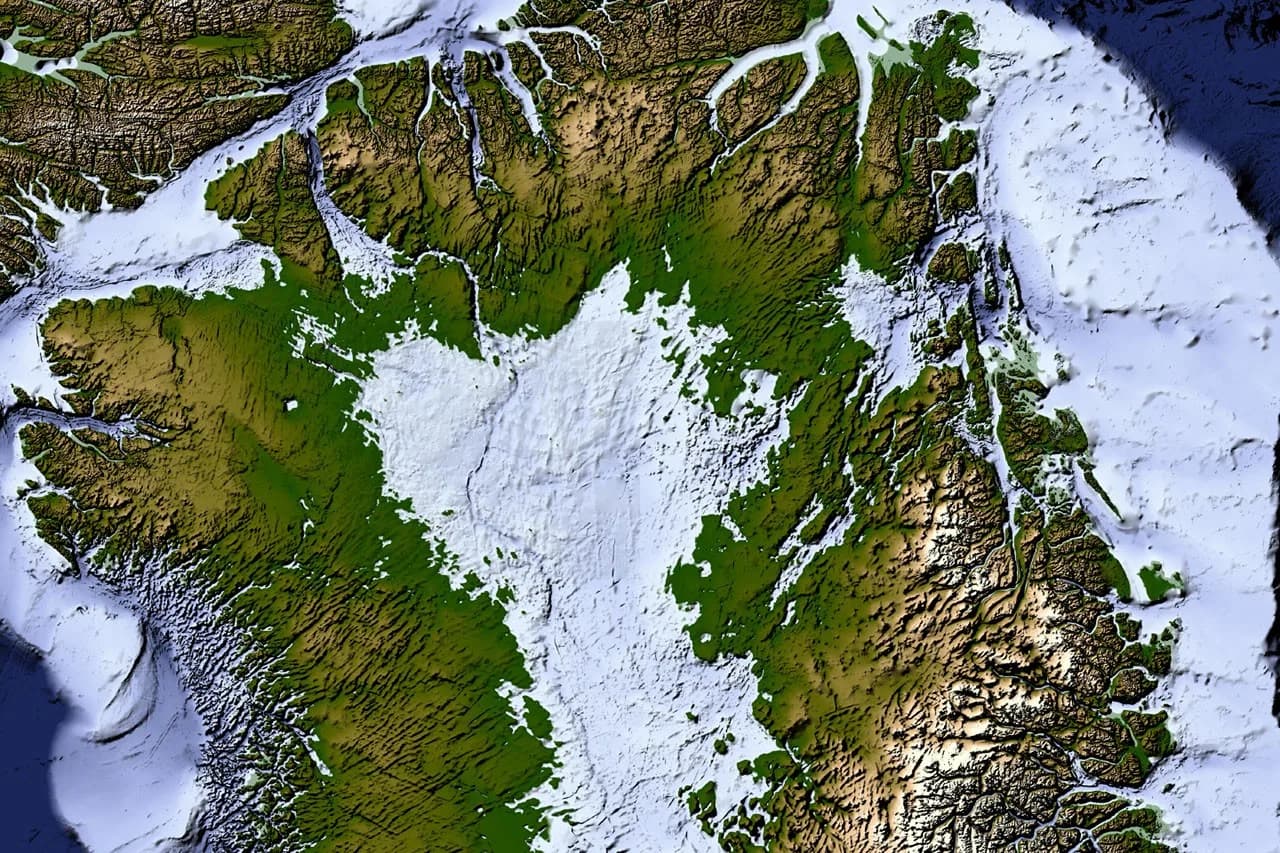
Greenland's ice sheet hides a landscape that cannot be viewed directly from above. A NASA-led team has now mapped 1,943 valleys in the bedrock beneath it, including roughly one-third that had not been identified before. The work uses faint changes on the ice surface as clues to the topography below.
Reading the ice from above
Ice flowing over a buried ridge or valley can leave a small signature at the surface. The researchers used a method called Ice Flow Perturbation Analysis to interpret satellite measurements of those signatures and manually trace valley networks. NASA's September 28 Earth Observatory account says this produced a more detailed view of the bedrock than previous mapping in several areas.
About half of the valleys already represented in BedMachine Greenland, a major under-ice terrain data set, appear to stretch farther inland than its map had shown. Some extensions run hundreds of kilometers. The new lines are inferences from ice behavior, however, rather than direct photographs of exposed rock.
Old geology, future ice flow
The patterns could offer clues to how Greenland looked before much of its current ice formed. Several valleys begin near southern and eastern highlands. In the west-central region, long straight valleys share a southwest-to-northeast orientation. The team suggests tectonic structure may have helped organize them, but NASA's Joe MacGregor says their origin remains a puzzle. Wide branching angles may also point to groundwater erosion playing a role alongside surface rivers.
Valleys matter because ice tends to concentrate in them as it moves toward coastal fjords. Knowing their position and depth can help models describe how the sheet responds as climate conditions change. It does not make a precise sea-level forecast on its own.
A map to test and improve
The study, published in Geophysical Research Letters, is intended to inform future versions of under-ice terrain maps. Better mapping could help researchers examine the longer-term movement of ice inland. For now, the map is a sharper hypothesis about hidden geography, with some features inferred from indirect satellite signals. NASA's accompanying map shows the result itself, making the otherwise invisible finding unusually tangible.
Sources
- NASA Earth Observatory, September 28, 2026NASA Earth Observatoryprimary source